


| Reports | |
Although you might use the report wizard to build the first version of a report, you can also choose to build a report manually. This chapter describes the creation of a simple report in order to understand how the report layout areas and the report structure work together to comprise a report.
For more sample reports, refer to Appendix E, "Sample Reports."
Creating a Report |  |
You create a report by selecting from the File menu New Report. Panther asks whether you want to use the report wizard:
For information about using the report wizard, refer to Chapter 5, "Report Wizard," in Using the Editors. To build a report manually, choose No. When you make this choice, Panther opens an unnamed report file and displays its layout window:
The layout window is one of two editing windows that you use to build a report. The second window shows the report structure and is opened by choosing ViewReport Structure. These windows offer complementary views into the report definition:
Laying Out the Report | |
The layout window typically contains several layout areas that define different components of a report's output—for example, detail data, column headings, page header and footer, and group subtotals. A layout area outputs data through the widgets that populate it. Each widget's properties determine the source and format of its data; the widget's position within the layout area determines where that output appears in relation to other output from the same layout area.
Most report output is generated through two widget types:
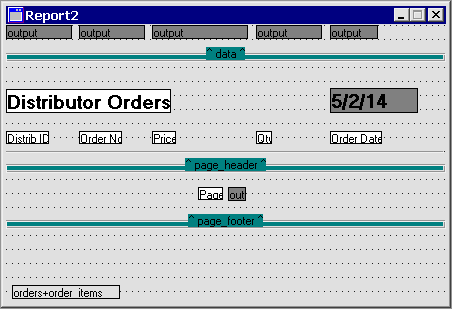
For example, the following report outputs order information and contains three elements—a page header, detail output, and page footer:
Output for each of these elements is defined in its own layout area. The following sections show how to create each of these layout areas.
Detail data is typically derived from a database; the data is output through dynamic output widgets whose database properties specify the source of their output. You can easily populate a detail layout area by copying widgets from an open repository whose entries were imported from a database.
Figure 4-1 Report whose output is composed of page header and footer data, and detail data.
Creating the Detail Layout
How to Create the vbizplus.dic Repository
NewRepository.vbizplus.dic.OpenDatabase.
ImportDatabase Objects, then choose Select All. Choose Import and then, once the import is complete, Close.The import process creates a repository entry for each imported table; included are a table view with the text widgets for every database table name, database columns, link widgets for table relations, and the primary key information. Table relationship information is stored in link widgets. Table views and link widgets are used by the transaction manager to fetch data.
For more information about repositories and importing database tables, refer to Chapter 11, "Creating and Using a Repository," in Application Development Guide.
This report's detail section is output through a layout area whose widgets are copied from the vbizplus.dic repository. Creating this layout area is a two-step process:
How to Define the Detail's Layout Area
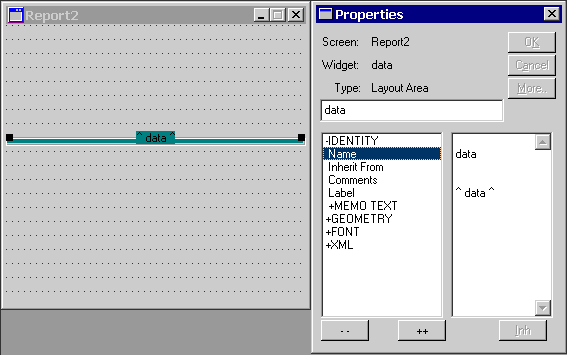
Layout Area or  .
.Panther creates an unnamed layout area widget, which defines the area above it:
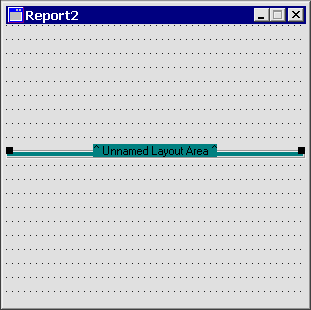
Note: You can locate a layout area anywhere within the layout window without regard to its actual output when the report is generated.
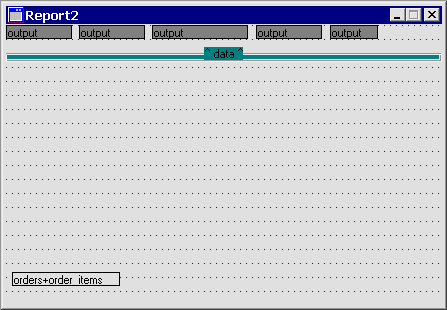
vbizplus.dic repository if necessary.orders and order_items.data layout area (either drag and drop or copy and paste):orders:
distrib_id, order_num, order_date
order_items:
Note that Panther automatically converts all copied widgets (except the link widget) into dynamic output widgets. Since the repository entries are imported from database tables, widgets can have the same name on more than one entry. Copy the widgets from parent table views first.
price, qty, and link widget K1order_items
odrer_date is to the right of price and qty in this example.
Bottom and SpaceHorizontal.order_date's Format Type property to MON/DATE/YR2 and its Max Data Length property to 8.
Note: Font properties for a report exist at three levels: for individual widgets, for report layout areas, and for the report as a whole.
The layout window should look like this:
The page header output shown earlier contains several static output widgets that contain column headings, a static output widget that contains the report title, and a dynamic output widget that contains the system date.
Creating this layout area is two-step process:
How to Define the Page Header's Layout Area
Layout Area or the corresponding toolbox button.data layout area.page_header.
Static Output or  .
.page_header area.Distrib ID for the widget above distrib_id's output.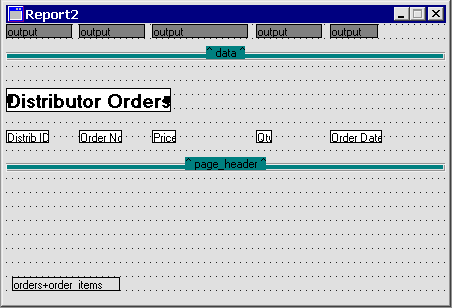
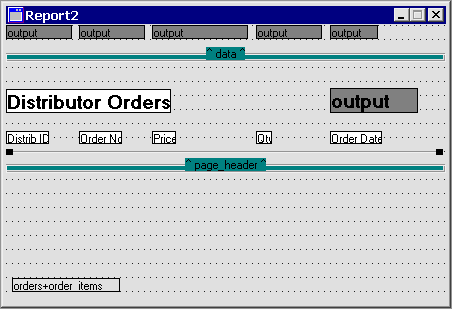
Dynamic Output or  .
.page_header area.8.Data Formatting = Date/TimeFormat Type = MON/DATE/YR2System Update = Yes
If desired, edit other properties. For example, you might want this widget to have the same font size and attributes as the report title.
Finally, create a line widget below the column headings. The layout window now contains two layout areas that look like this:
The page footer output shown earlier contains two widgets: a static output widget whose Label property is set to Page, and a widget that outputs the current page number.
page_header and set the name of the layout area widget to page_footer.Page.Dynamic Output or the corresponding toolbox button.
page_footer area.
3.
The finished layout window should look like this:
For more information on layout area properties, refer to "Editing Layout Area Properties."
Building the Report Structure | |
While layout areas define the physical layouts used by a report and the relative positions for the widgets within the layout areas, specifications for report generation are defined in the report structure. To view a report's structure window, choose ViewReport Structure. A new report has this empty structure:
The initial structure begins with an unnamed report node. This node and the nodes connected to it define the report. Through their properties, each one defines an aspect of the report or an action performed during execution. For more about node types, refer to "Node Classes and Types."
To generate the report shown in Figure 4-1, you need to modify this structure to include these nodes:
How to Print Page Header and Footer Data
Print or  .
.Panther creates a print node directly below the page format node, which replaces the empty page header:
page_header: either select this layout area from the drop-down list, or enter the name directly.Print or the corresponding toolbox button.Panther replaces the empty footer node with a print node.
page_footer.The report structure now contains print nodes for page header and footer output:

A report relies on the structure's detail node to fetch data. Detail node properties specify how the report fetches its data; the print node attached to a detail node specifies when this data is presented.
Detail or  .
.
The detail node's Data Source property (under Identity) is initially set to TM View. At runtime, this setting specifies that Panther's transaction manager generates the SQL needed to fetch the report data. A report created by the report wizard or built from repository components like this one contains the table views and link widgets required by the transaction manager.
To make sure that the fetched data is sorted appropriately, set the root table view's Sort Widgets property:
Widget List) and select the orders table view widget.Select Handling, set the Sort Widgets property to these widget names:
distrib_id
order_num
order_date
Print or the corresponding toolbox button.Panther creates a print node directly below the detail node.
data.The report structure now contains a print node for outputting its detail data:

Group or  .
.Panther creates a group node directly below the detail node.
distrib_id. This property specifies how to group data at runtime—in this case, to generate a group for each distrib_id value.distrib_id value is output.The report structure now contains a group node for grouping report data on distrib_id:

Testing the Report | |
The editor has its own viewer, which you can use to view report output at any stage of the editing process. To test the report built in previous sections:
The viewer outputs the report, scaled initially to fit in the viewer window. To view the report scaled to 100 percent, choose ViewActual Size or the corresponding toolbar button:
Figure 4-2 The report viewer lets you preview and evaluate report output during an editing session.

Figure 4-3 The final layout and Report Structure windows show how the views interact together to create the final report.
Adding an Item to the Repository | |
Panther can calculate certain values, such as group or report totals, which can be defined in the report. However, some information is not so easy to calculate, or it is useful to have available for more than one report. For example, for the orders in the vbizplus sample database, you would like to know the total price for each order. To make the totals available for all reports, and for the report wizard, you can add the value to the repository.
vbizplus.dic repository.order_items repository entry by viewing the repository table of contents. (Choose ViewRepository TOC and then select order_items from the list.)Total_price under Identity.total_price under Identity.
Fetch Data, set Use in Select to Yes.
qty*price.
Max Data Length to 6.
Justification to Right.
Data Formatting to Numeric.
Format Type to 2 dec places with commas.
The item order_total is now available for use in screens and reports.
Figure 4-4 The total price is now available for the report.
Running the Report | |
While you are developing a report, you can preview the output in the editor. After the report is finished, there are other ways to run the report. You can use the report viewer from the editor screen or from an application that uses the default Panther menu. From outside the editor, you can use the command line utility rwrun, or you can call the report from within another Panther application, using the JPL command runreport, or the library function sm_rw_runreport.
The report can be run locally, with its own connection to the database, or it can be run remotely in the three-tier environment, taking advantage of the server's connection to the database. To run it remotely, the report must reside in the server's library. The report can be viewed onscreen, saved to a file, or sent to a printer.
For more information, refer to Chapter 9, "Running Reports."