


 | Using the Editors |     |
The report wizard helps you design a Panther report that uses Panther's transaction manager to fetch data. It collects design information through a series of dialogs. Though simple to use, the report wizard builds sophisticated reports that you can use unchanged or easily edit for added functionality and refinements.
Invoking the Report Wizard |  |
To use the report wizard, you must:
@DATABASE (specified in the object's Inherit From property). This property setting is the result of importing the desired database objects. (Refer to "Creating and Opening a Repository" for details.)
If you wish to add any items, such as The report wizard stores and uses information in the open repository to build new reports.
Now you can use the report wizard.
total_price, to the repository, it is necessary to do so before invoking the report wizard to make the item available to the wizard. For more information on adding an item to the repository, refer to "Adding an Item to the Repository" in Reports.
How to Run the Report Wizard
 New
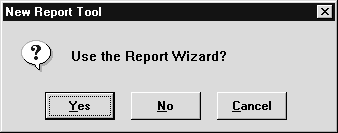
New Report. The New Report Tool dialog box opens:
If the template report in the repository is from an old version of the report wizard, you are asked whether to replace it. If you made changes or additions to the template screen, first back it up, then let the report wizard overwrite it. Later, you can restore your changes to the new template.
Note: If the report wizard needs to add or update its template screen, make sure you can write to the open repository. If the repository already contains a valid template screen, write permissions are not necessary to run the report wizard.
If you choose No, a blank, untitled layout window opens in the screen editor workspace. If you choose Cancel, the new report operation is canceled.
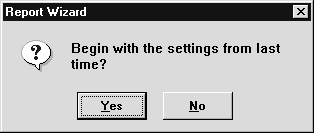
Choose one of the following:
From this point, you are guided through several dialog boxes where you make these choices:
Report Types |  |
The report wizard can create six report types, described in the following sections.
Record-by-record reports present each row in the select set individually. If you select group fields for the report, the data is sorted according to those groups, and a heading containing the group value is printed before the data. If any totals are requested, those totals appear after the data for each group.
In this example, distrib_name and order_num are group fields, and total_price is a total field.
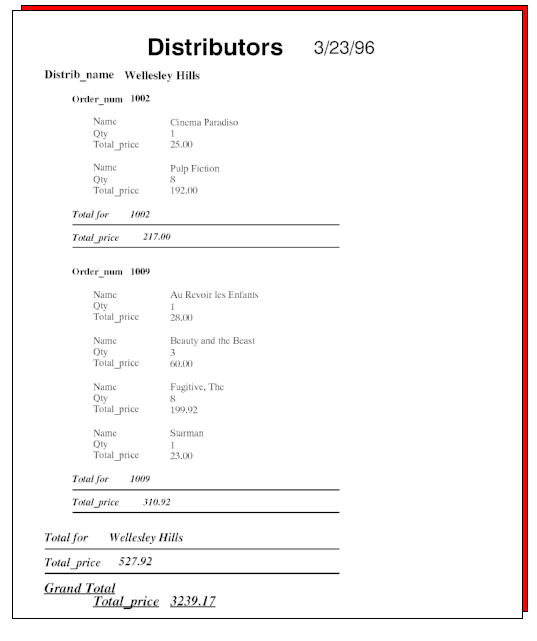
Figure 5-1 Record-by-record reports list each row of data individually within group headings.
Column reports present the data in columns. A single heading contains the column labels; the data is printed below each column label. If totals have been specified, they appear after the data for each group.
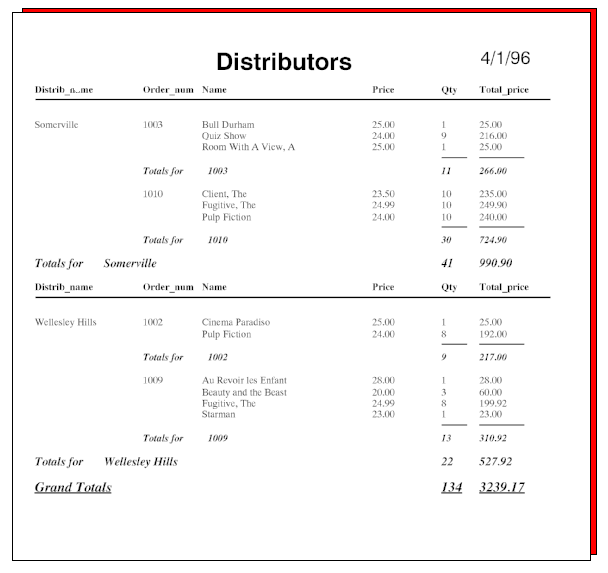
Figure 5-2 Column reports list the data in columns across the page.
Row reports present the data in rows across the page. Column labels are displayed on the left side of the page. To the right of each label are the values for that column. If totals are requested, row totals appear at the end of each row, and totals for higher-level groups appear after each set of row data.
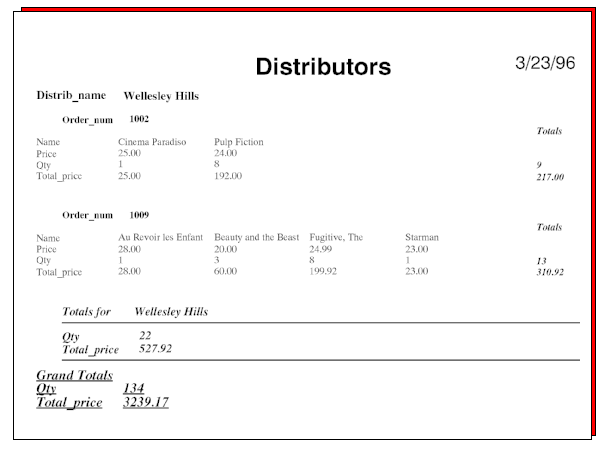
Figure 5-3 In row reports, the data for each column appears in a row across the page.
Graph reports display numeric data as pie or bar charts. A single report can contain a series of graphs depicting the detail section of the report, the totals section, or a combination of the two.
A graph in the detail section plots a numeric column's values for an entire group on one graph. If your report includes two or more numeric data columns, you can plot them on a single bar graph or plot each separately.
In this example, the detail data is displayed as text and in a graph while the totals are displayed as text only. The two numeric fields are displayed together in a multi-series bar graph.
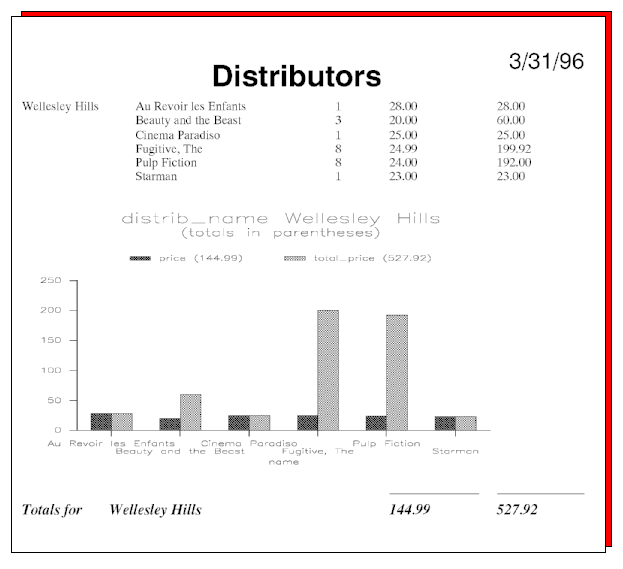
Figure 5-4 Graph reports can present detail data or totals in pie or bar charts.
A matrix report presents data in a cross-tab format with totals reported independently for each row and each column in the matrix. You can also select a data group that sorts the data so that the report contains a matrix for each group. Generally, numeric data is selected to be in the cells of the matrix itself, but the column and row headings can be any column in the database.
The data items are positional in the appropriate cell; the labels for the data items appear before the matrix, following the group name. In the following sample report, the cells report the data for the qty and total_price columns.
For each fetch, a cell contains the fetch's values for the database columns that label the matrix. If more than one fetch has data for a given cell, the cell shows their total.
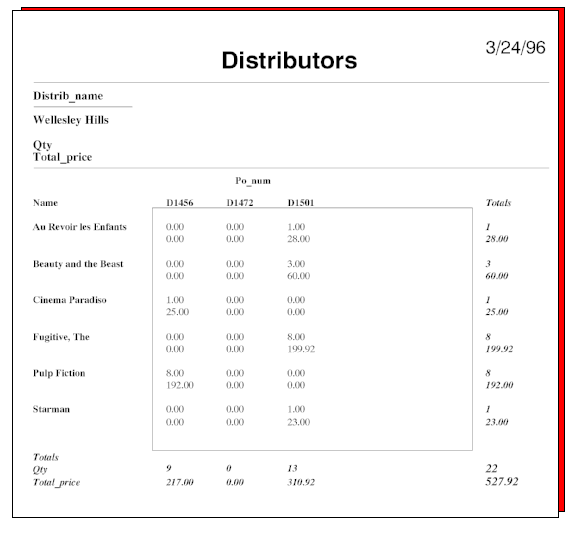
Figure 5-5 Matrix reports total the values both horizontally and vertically for each cell column.
Address label reports produce formatted output for label sheets. The wizard aligns the widgets vertically, one widget per line. After the wizard is finished creating this report, edit the layout window and move widgets to new positions if you want more than one per line.
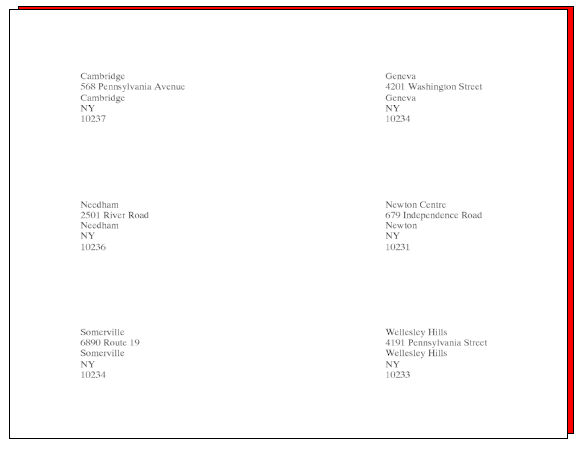
Figure 5-6 Address label reports lets you choose the number of columns per page and the number of rows per page.
Report Wizard Dialogs |  |
The report wizard guides you through a variety of dialog boxes, prompting you for information it needs to create the appropriate presentation for your report.
The first dialog displayed by the report wizard, Table Selection, asks you to select the report type and root table view—the database table that forms the basis of the report:
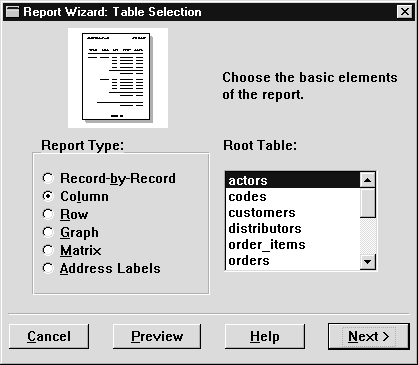
Figure 5-7 On the Table Selection dialog, choose the basic structure of the report.
The root table view is the database table that forms the basis of the report. For example, a report that shows orders for each distributor can use a table view that contains distributor names for its root table view. Your report can contain data from the root table view and any table view related to it.
In the Column Selection dialog, you specify the columns to appear in the report. When the dialog opens, it lists all table views that are related to the root table view. The list is organized according to the link relationships in the repository. The root table view you selected earlier is at the top of the list. Levels of indentation indicate how all other tables are linked to the root table view and to each other:
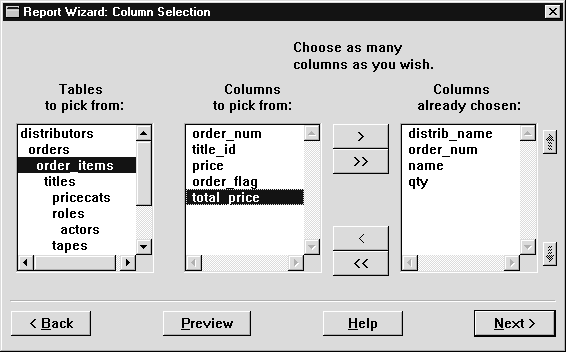
Figure 5-8 The Column Selection dialog displays a list of table views in the open repository.
When you select a table view, the adjoining list is populated with the names of columns in the selection.
In the Data Group Order dialog, you specify which columns to use for grouping data. Groups can help clarify relationships among data; they also let you subtotal data. For some types of reports such as matrix reports, you must also select row and column headings.
This dialog contains two list boxes. The bottom list box contains the columns chosen in the previous dialog. The list box above it, initially empty, shows the columns selected to define data groups. The first item in this box defines the primary group. Each subsequent item defines another group that is subordinate to the one listed above it.
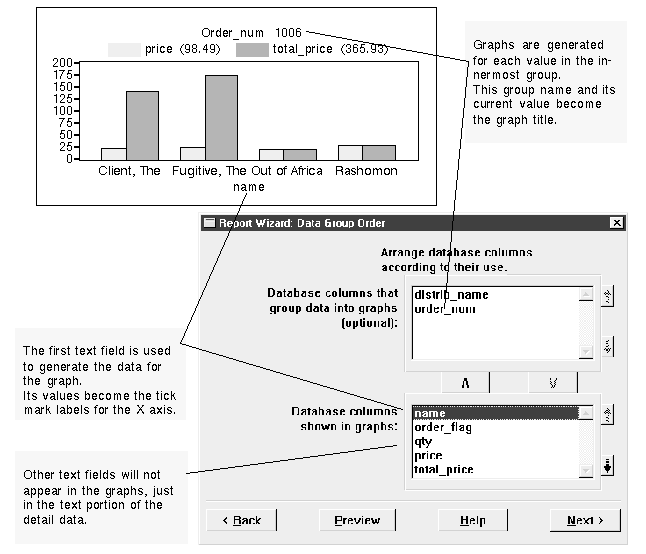
Figure 5-9 In the Data Group Order dialog, select the columns that will sort the data.
 .
.To create matrix reports, you must select labels for the data displayed in the matrix in addition to any group fields. For each group field, the report generates a separate matrix.
By default, the wizard lists all numeric columns in the bottom list box (Show in Matrix Cells):
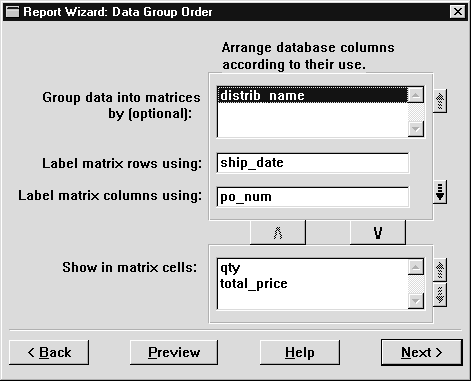
Figure 5-10 For matrix reports, choose row and column headings along with the data groups.
 .
. .
.
The previous selection moves up to the Label Matrix Rows Using list box.
In the final report, a separate matrix is created for the entry in the Group Data Into Matrices By list box. If more than one entry is listed, the first item in the group list specifies the primary group. Items below it specify subordinate groups in descending order.
Within each matrix, the cell entries are determined by the column label and the row label. When choosing the column label, you might want to consider the number of unique entries for that database column. The amount of space needed to report on each unique entry might exceed the width of the report. If this occurs, ellipses indicate the missing entries.
In the Graphs and Running Totals dialog, you decide which data to total and how to present the data. After numeric columns are selected, the default choices specify the display of all detail data with group totals. You can choose to view only the totals or only the detail data. You can also view data in graphs. The options that you can access in this dialog depend on the report type.
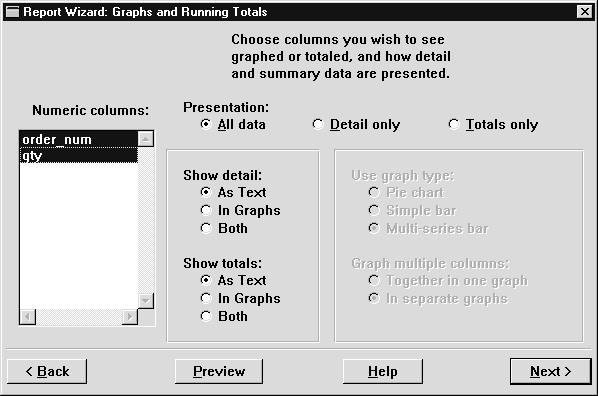
Figure 5-11 The Graphs and Running Totals dialog lets you decide how to present report data.
Click+drag or Shift+click to select contiguous items, and Ctrl+click to select non-contiguous items.
For matrix reports, Show Totals is the only available option because each cell in the report already totals all database rows matching the cell's row and column headings.
Use graph type
Graph multiple columns
If you choose Pie Chart or Simple Bar, each graph shows the data of one fetch. If you choose Multi-series Bar, the graph plots the history of all fetches for the innermost group.
In the Final Report Settings dialog, you set some final presentation options. The content of this dialog varies for each report type:
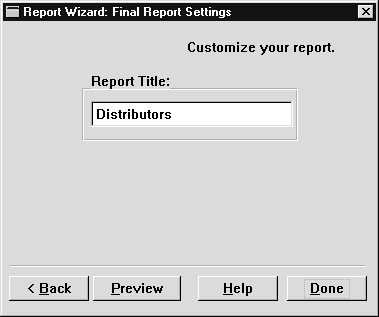
Figure 5-12 Add the final touches to your report on the Final Report Settings dialog.
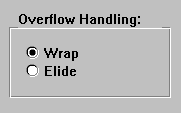
Choose Wrap or Elide:
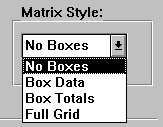

The screen editor resumes control and displays the layout window for the completed report. To test the report output, connect to a database and choose either Report Preview Report or File
 Test Mode.
How It Looks |  |
When the report wizard is complete, the layout window for your report appears in the editor workspace. You can save it and use it immediately, or you can continue to work on it—rearrange widgets, add decorations, or change property settings.
The layout window contains the layout areas created for the report. A horizontal line across the entire window defines the end of each layout area; the name of each layout area appears at the center of this line. The order of the layout areas is independent of how they appear in the report, which is determined by the report structure.
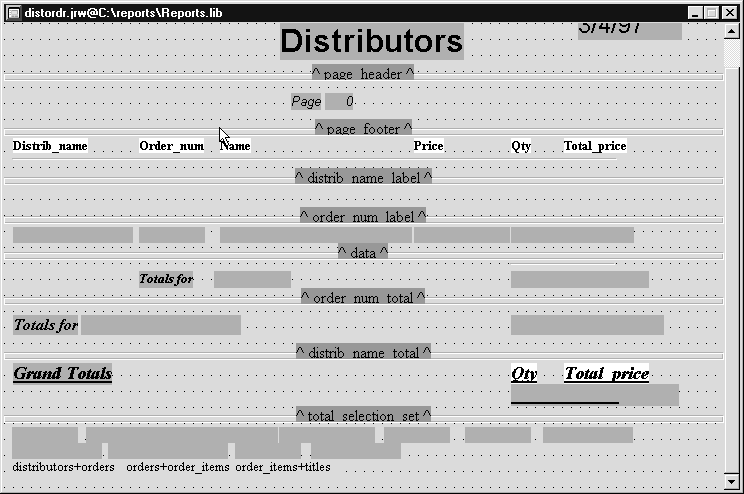
Figure 5-13 The layout view contains the layout areas formatted as they will appear in the report.
Generally, the layout window for wizard-created reports contains layout areas for these report components:
All widgets that output data are located in layout areas. The unnamed area of a layout window—that is, the space below all named layout areas—contains widgets that do not output data. The wizard places link widgets and history widgets in this area. They are needed to calculate and fetch data for the report, but they are not needed in the report layout itself.
For further information on report layout, refer to Chapter 2, "Introducing Report Layout," in Reports.
The report structure window displays a diagram of the report structure. Each report element—format, data groups, detail data, and the report itself—has a corresponding node in the structure:
The main report node appears at the top of the report structure; its page format node is directly below it. The detail node specifies how the data is fetched for the report. Each data group level has a corresponding group node whose footer performs the calculations for the group totals. The print nodes attached to the detail and group notes have associated layout areas to provide the report output.
For further information on report structure, refer to Chapter 3, "Introducing Report Structure," in Reports.
Report Structure Window
Figure 5-14 The report structure window schematically shows how a report executes.
Including Graphs |  |
Numeric data in your report can be presented as a graph. Both pie and bar charts are available and can be specified in the Graphs and Running Totals dialog.
The selection of data groups determines which column values are selected to appear in the graph. The graph is created for the innermost data group.

Figure 5-15 This graph, which is for an order in the vbizplus database, shows the film titles that are included in the order and the price and total price for each film title.
Because graphs display numeric data, text columns in the data set are discarded if only graphing options are chosen for the detail data section.
If your report includes two or more numeric data columns, you have a choice of graphing options. You can choose to plot them on a single graph. Alternatively, you can graph each separately, and so plot the column's values for an entire group in one graph.
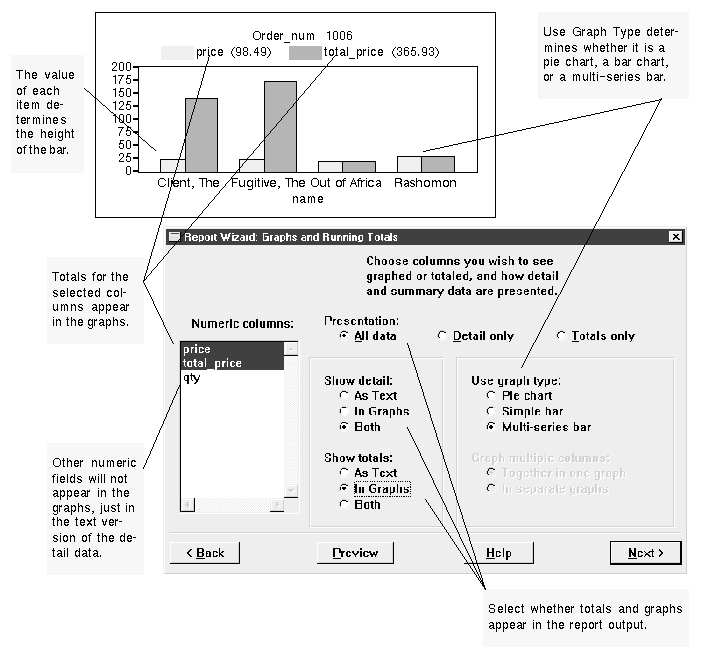
Figure 5-16 In this report, the detail section of the report will contain text output and business graphs while the totals section will contain only business graphs
Note: A report that runs in character mode omits display of graphs. However, a layout area is created for the graph, which displays on other platforms.


