


| Application Development | |
Panther's debugger provides you with the ability to view and analyze all application components. You can view the application's execution from various perspectives with varying degrees of detail. You can examine and debug client and server components. You can:
Note:
Events in the JetNet middleware API are not recognized in the debugger.
This chapter describes the features of the Panther debugger and how to use it. If you are developing a two-tier application, the debugger is already linked in with your development executable (prodev) so you can debug client screens. If you are developing a JetNet or a Oracle Tuxedo application, you need to run a standard server in debug mode to debug service components and services.
Debugging Services and Service Components |  |
If you are developing a JetNet or Oracle Tuxedo application, you can run a debuggable server so that you can monitor what the server is doing while it is processing service requests. Running the debugger on a server lets you see the service components that are on the server machine.
You can run the debugger on a server provided the following two conditions are true:
Set the appropriate timeout options in your client code. For example:
TIMEOUT parameter to specify a large or infinite timeout.
NOTIMEOUT option to prevent blocking timeouts.
TIMEOUT parameter to specify a large or infinite timeout.
The application's default blocking timeout is established for the application as part of the server configuration. For information on setting the Default Blocking Timeout parameter, refer to "Default Blocking Timeout" in JetNet/Oracle Tuxedo Guide. For Oracle Tuxedo users, refer to your Oracle Tuxedo documentation for information on SCANUNIT and BLOCKTIME configuration parameters.
How the Debugger Works | |
Many debuggers do their work by invoking the applications they analyze. The Panther debugger is invoked by your application, that is, by Panther itself. Panther notifies the debugger of each significant event in the application, as it occurs. Each time it is called in this way, the debugger analyzes the event and saves any information it needs. In most cases, the debugger then immediately returns control to the application. Some events, however, cause it to emerge or awaken from the background to halt the application and display its state.
Panther is shipped with the debugger already linked in for client executables. To enable debugging for server executables, your standard server (refer to "Server Details" in JetNet/Oracle Tuxedo Guide) must be initialized as a debuggable server.
The debugger runs in the background during test and application modes, you can direct the debugger to run automatically, or you can manually break execution. The debugger follows the directions you give it and awakens accordingly—for instance, if an event triggers a breakpoint you have defined, or if the value of an expression you are monitoring has changed. The debugger comes to the foreground and awaits your action: provide additional analysis of the application, modify data, set breakpoints, or put it back to sleep and return control to your application.
Choose Options Enable Debugger. This instructs the debugger to awaken immediately upon entry into test mode.
Choose OptionsDebugger, or press the DBUG key. To put the debugger to sleep and return to test mode, choose FileResume Application.
If your application's menu bar is displayed, you can enter the debugger by pressing the DBUG key or switch menu bar scope by pressing the SFTS logical key, from where you will have access to OptionsDebugger.
Do either of the following:
Resume Application to put the debugger to sleep and continue running/testing your application. Panther preserves the debugger state; if the debugger is reentered, all breakpoints and configuration preferences remain unchanged. Moreover, all breakpoints and break events are ignored until you explicitly reactivated the debugger.
The debugger provides several windows to monitor application execution, each offering a different view into the application. The windows can be opened and closed from the debugger's View menu by choosing from these options:
Views into Your Application
Toggle Location Break or by double clicking anywhere in the line. Breakpoints are identified by an asterisk following the line number. For more information on using the Source Code window, refer to "Viewing JPL."
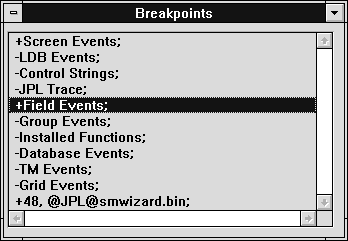
Figure 39-1 The Breakpoints window shows currently identified breakpoints.
Activate or deactivate a selected breakpoint by choosing BreaksEnable or BreaksDisable or by double clicking on the item. Use BreaksSelect All if you want to enable or disable all listed breakpoints.
Choose BreaksShow Source to view the source code associated with a location breakpoint.
For more information on setting breakpoints, refer to "Setting Breakpoints."
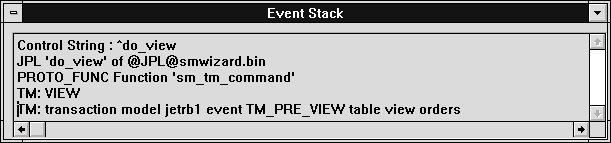
Figure 39-2 View the call hierarchy in the Event Stack window.
Configuring the Debugger | |
You set debugger operation preferences via the Options menu, and they are saved in the file prodebug.cfg in the current working directory. You should not manually modify this file.
Debugger activity can be logged to a user-specified file.
Choose OptionsStatus Log. The Status Log Options dialog box opens.
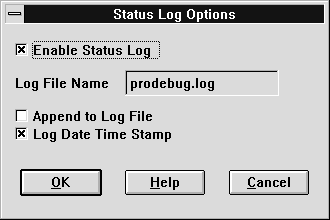
Figure 39-3 The Status Log Options dialog allows you to specify your log file preferences.
From the Status Log options dialog, you can:
Choose FileOpenLog File anytime while using the debugger.
The following debugger preferences are available from the Options menu:
When this option is disabled, the debugger, when awakened, restores its windows exactly as you left them.
Debugger Menu Bar | |
The debugger menu bar provides easy access to debugging operations. Following is a brief overview of the File, View and Tools menu options. The features controlled by the remaining menu options are described in their own task-defined sections; a cross-reference is defined for these options.

Figure 39-4 The debugger menu bar includes a Tools menu option when the debugger is run in expert mode.
The operations associated with the File menu are:
Save Preferences on Exit, which saves them at the state they are in when you exit. For more information on setting debugger configurations, refer to "Configuring the Debugger."
The Tools menu is only available when running the debugger in expert mode, and includes the following features:
Status Log Options and set Enable Status Log on the Status Log Options dialog.
The View menu provides several windows to monitor your application's execution. Refer to page 39-4 for a full description of the options available from the View menu.
Options available from the Windows menu allow you to:
The Edit menu commands provide standard file editing operations, such as Copy, Paste, and string search commands Find and Find Next, that you can use when accessing text data in the Source Code window. For more information on the Source Code window, refer to page 39-11.
The Trace options allow you to step through program execution one event or breakpoint at a time. For more information on tracing, refer to page 39-19.
Breaks menu commands let you establish and manipulate breakpoints in your application—places where execution will be interrupted and the debugger will assume control. For further information on setting breakpoints, refer to page 39-20.
Provides options for setting debugger preferences. For information on debugger preferences and configuration, refer to page 39-6 .
Edit
Trace
Breaks
Options
Viewing JPL | |
To access JPL in libraries, the module must be in binary format and must also include the JPL source code. For information on compiling JPL source code, refer to page A-20.
Choose ViewSource Code. The Source Code Window opens.

Figure 39-5 The Source Code window displays a JPL module with a breakpoint set at line 48.
The Source Code window can display any JPL code contained within your application. It can be:
You can set breakpoints on any line of code that is displayed in the window. The Edit menu provides string search capabilities.
From the Open Source Module dialog box you can specify a module to read into the Source Code window. You can also select a module from which to establish a location breakpoint.
Opening a Source Module
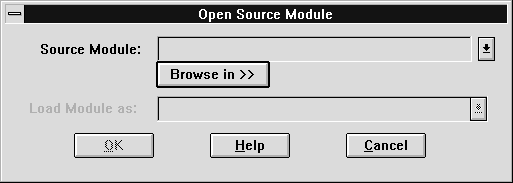
Figure 39-6 Specify a module to read into the Source Code window or select a module for the Edit Breakpoint window in Location mode.
OpenSource Module. The Open Source Module Window opens.

Figure 39-7 The Browse Library Member window shows open libraries and their members.
A Browser dialog opens. The title bar on the browser window reflects the location chosen. If no source code is available for the chosen location, the debugger informs you.
JPL modules stored in libraries must include the source as well as the binary format. By default, JPL modules created within the screen editor are stored with both formats. However, if compiled JPL is put in a library outside of the editor (using the jpl2bin and formlib utilities), do not use the -
r flag with jpl2bin.

Figure 39-8 The Browse window displays the available JPL code corresponding to the browser location selection.
If a request to open a screen contains JPL modules of more than one type, for instance screen- and widget-level JPL, the choices are listed in the Load Module As option menu. Select the desired type of JPL module.

Figure 39-9 Screen JPL associated with a screen or service component can be selected for viewing.

Figure 39-10 The Source Code window displays screen JPL code from a specific screen.
Choose BreaksToggle Location Break, or double-click anywhere in the line. This option toggles a breakpoint on or off on the current line of code. Breakpoints are identified by an asterisk following the line number.
Viewing Application Screen Information | |
The debugger provides access to the programmatic components of your application, such as screens and service components. To view the programmatic details, choose WindowsApplication and select the desired item from the list. The selected item comes to the foreground and you can access details for the following options from the Application Window menu:
OpenSource Module (refer to page 39-12).
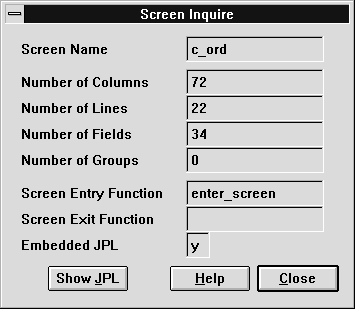
Figure 39-11 The Screen Inquire window displays useful information about the selected screen.
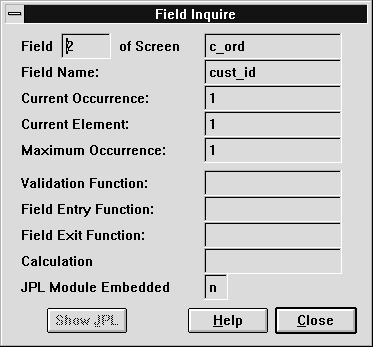
Figure 39-12 The Field Inquire window displays useful information about widgets on a screen.

Figure 39-13 The Group Information window.

Figure 39-14 The Control Strings window shows that Ctrl+E is mapped to the Esc key.
Notes: To see additional properties or attributes of any screen or widget you can use the JPL properties syntax to define an expression in the Data Watch or Application Data windows.
Refer to page 39-26 for information on using the Application Data window.
Refer to page 39-27 for information on using the Data Watch window. For information on JPL properties syntax, refer to page 19-33.
You can use Data Watch to inspect a property of the application, a screen, or widget, with an expression using the JPL properties syntax.
Stepping through Program Execution | |
When the debugger breaks program execution and comes to the foreground, you can step through the execution of your application with the options provided by Trace menu (or via the debugger toolbar):
If you run the debugger in expert mode you can fine tune tracing to differentiate between parent, child, and same-level events. Choose the appropriate level:
Any Level
If the current context is a JPL procedure or control string, the debugger steps to the next executable statement or string and stops. Otherwise, the debugger stops at the next event. This option is the same as TraceTo Any Event in normal mode.
This Level
If the current context is a JPL procedure call, the debugger "steps over" that procedure's statements, and breaks on the next statement at the same level, if any. If the context is a control string, the debugger steps over any strings embedded within it. Otherwise, the debugger breaks at the next event ignoring sub-events.
Higher Level
Breaks only at the next level up in the event stack. If execution is already at the topmost level, program execution resumes, breaking only for JPL breakpoints.
You can set the debugger to run on automatic pilot, where application execution events can be observed hands-off in the various View windows.
Animation.To Breakpoint. The debugger refreshes all open windows on each execution event until the next breakpoint occurs.
For example, if the Source Code window is open, the debugger scrolls through each line in the current JPL procedure as it executes; if the Data Watch window is open, variable values are refreshed whenever they change.
Animation proceeds until you toggled it off from the Options menu or interrupt it with the EXIT key.
Setting Breakpoints | |
The debugger recognizes all major execution events in a Panther application as potential breakpoints, with the exception of request broker events.
Breakpoints can be set at:
The debugger gets control at every execution event and potential breakpoint. It then decides whether or not to awaken, and whether or not to break execution. The decision is based on your Trace choice, and whether breakpoint conditions are satisfied.
If you are not running the debugger in normal mode, you can set location breakpoints in the Source Code window and modify the predefined execution events in the Breakpoints window. In expert mode, you can you can add and modify breakpoints of both types via the Edit Breakpoint window.
Location breakpoints are JPL statements that are marked in order to stop program execution. The debugger comes to the foreground whenever Panther encounters them. You can set breakpoints on any JPL code that is displayed in the Source Code window—on both called-up source code as well as current (active) source code.
Refer to page 39-11 for information on viewing JPL.
Setting Location Breakpoints
Toggle Location Break, or double click on the line. The breakpoint is toggled on or off. Breakpoints are indicated with an asterisk (*).
You can set breakpoints at a variety of execution events. A finer control of event filtering is available for certain GUI events when running the debugger in expert mode. Request broker events are not recognized by the debugger.
Table 39-1 list the types of execution events on which you can set breakpoints
Breakpoints. The Breakpoints window is displayed with the predefined events listed. You can add and edit both location and event breakpoints, and perform other actions. There are two modes: Event and Location. Select the appropriate check box: Break At Event for events (the default setting), and Break At Location to edit source code breakpoints.
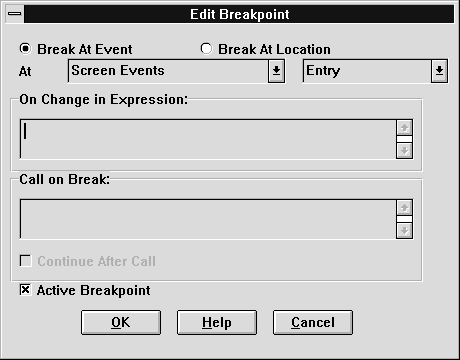
Figure 39-15 In expert mode, use the Edit Breakpoints dialog to add or modify breakpoints of all types.
In general, it is easier to set location breakpoints by reading the code into the Source Code dialog box and double-click directly on the specific line of code to set the breakpoint.
Refer to page 39-16 for details on setting breakpoints in the Source Code window. Or, you can set a breakpoint from the Edit Breakpoint dialog box:
For instruction on how to identify source code from the Open Source Module, refer to page 39-12. Once you choose the module from Open Source Module, the Edit Breakpoint dialog box redisplays.

Figure 39-16 Use the Edit Breakpoint dialog box in Location mode to set a code location breakpoint.
You can direct the debugger, in expert mode, to make activation of a breakpoint dependent upon the value of an expression.
Add or Edit. The Edit Breakpoint dialog box opens.To Breakpoint was chosen.From the Edit Breakpoints dialog box, enter the JPL or installed function to be executed in the Call on Break field. The debugger calls the specified function each time the breakpoint is reached.
To instruct the debugger to call the function without stopping execution, check Continue After Call.
Monitoring Variables and JPL Expressions | |
When running the debugger you can examine the contents of variables or expressions and observe runtime changes. Use the Data Watch window to inspect a property of the application, a screen, or widget, with a JPL expression. For more information on referencing Panther objects and properties, refer to page 19-33 .
Data Watch. The Data Watch window opens and displays the names of variables and expressions along with their current values (if defined).
If variable is an array and you have defined as a range of values to watch, the variable is represented as
@range("variable
",
startOcc
,
endOcc). For example,
@range("title_id",2,4)displays the title_id values associated with the second through fourth occurrence of an array.
The debugger displays the values of the variables/expressions in the Data Watch window, updating them as execution proceeds. The location of any variables specified is also identified.
To clear a variable/expression, delete it from the list. To clear all variables/expression, press CLR.
Run the debugger in expert mode to take advantage of the data watching abilities available with the Application Data window.
Application Data to open the Application Data window.