| Bug # |
Summary |
Platform |
| 38077 |
The Group By property is ignored if no field in the table view has the Having property in Transaction Manager. |
all |
| 38203 |
If a field exit function returns 1, field exit processing should not move
the cursor. |
all |
| 38176 |
The Control String function doesn't run if the field validation function
calls sm_gofield when @app()->gofield_continue_val is set. |
all |
| 38211 |
Cannot change menu item without flushing screen with a "msg emsg" command. |
all |
| 38249 |
In the GUI Report Writer viewer, widgets now have their background color
type set to Scheme. |
all |
| 38250 |
In Panther 5.30, the Transaction Manager generates selects with incorrect GROUP BY clauses. |
all |
| 38266 |
When a field has an input mask set, one cannot position cursor in the last position character of the field. |
all |
| 38138 |
Support TIFF images in RW/Pdf driver for Windows 64bit. |
Win64 |
| 38210 |
New function sm_com_attach() to attach to an active COM object. |
|
| 38255 |
Added Trace Hooks in Java Code. Sm_trace() now accepts the "JAVA" and "NOJAVA" options. |
all |
| 38263 |
New User function to get OCI handles for Oracle database connection. |
all |
| 38270 |
Ability to change Application Font and Status Line Font at runtime. |
all |
| 38273 |
Error at start-up of prorun, "Error: library /§à could not be opened." |
all |
| 38259 |
The Sybase DB-Library driver can crash when closing a connection. |
all |
| 38242 |
The Recently opened menu should be a Recent files menu with new and saved items included. |
all |
| 38257 |
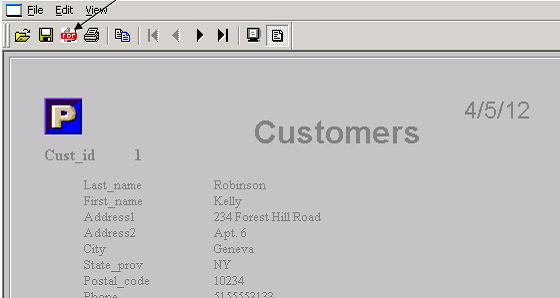
'Save as PDF' icon in ReportWriter Menu. |
all |
|
|
ACT NOW! JAM/Panther Maintenance Amnesty with "FREE" Product Upgrade Program is Coming to an End
Between now and August 31st 2012, any JAM or Panther license that is currently
unmaintained, can be re-instated without penalty*. Simply purchase a minimum
of 1 year's maintenance going forward and you will have full entitlement
to support services and license keys.
Keep in mind, you may upgrade to the latest version of the product and
associated database drivers at no extra charge. Also please inquire about
converting these reinstated licenses to an alternate platform to get the
most out of your investment. For example, you can reinstate JAM 7 on SCO
and end up with Panther 5.3/Oracle10g on Linux or Windows with 1 year support.
Please contact crm@prolifics.com to discuss your needs and finalize your cost before August 31st. Act now!
*50% cost of product |
|
Panther's New Trace Feature: Frequently Asked Questions
1. What is the new tracing feature?
It is a new feature in Panther 5.30 that allows Panther application developers
to create Trace and Dump files to document Panther events as a Panther
application is running. Trace files are written as the events occur and
dump files are written upon request. Dump files can be much smaller than
trace files and can be created after unexpected events.
2. When would you use this feature?
When trying to debug your Panther application or when trying to understand
the logic of your Panther application.
3. How do you turn on tracing?
You can initiate this feature at startup time by updating the smvars like
below:
SMTRACE = TRACE NORW TRACEFILE="c:\test\Panther Trace"
The above command turns tracing on, ignores Report Writer events, and writes
the trace to: "c:\test\Panther Trace".
While the application is running, you can call the sm_trace() function
from your JPL to control it. See below:
call sm_trace('TRACEFILE ="/usr/panther/app1/trace.out" DUMPFILE
= "/usr/panther/app1/dump.out" FRAMES=400 NONE DBI CSTR LDB')
The above command turns tracing on and writes the trace to /usr/panther/app1/trace.out
. It will store up to 400 events in your dump file in /usr/panther/app1/dump.out.
Events that will be logged are database calls, Control String and LDB Events.
NOTE: NONE must be included if you want to trace only a few Panther events.
4. I want to trace all the Panther events. Is this doable?
Yes it is. Just use the argument "ALL".
5. What is the return value of sm_trace()?
If there are no errors, 0 is returned. Otherwise, an error code is returned indicating that one of the tokens in the parameter list is invalid. See error codes list.
6. What is the difference between a trace and a dump?
Trace files are written as events occur. This file can become rather large
in size. Dump files are created on demand, so they can be created when
an unexpected event occurs.
7. I am running an older version of Panther. Can I get a patch for this
trace feature?
This feature is only available for Panther 5.30 on all supported platforms.
8. Can I trace my C Code with the trace feature?
It will trace your C Code only if the C code causes Panther events to occur,
for example, if the C code makes database interface calls or invokes a
field validation function.
9. Will this trace feature trace my Java Code?
The interactions with Java and Panther are traced, and not the actual Java
Code. You will need the patch for Bugsy 38255 (Add Trace Hooks into Java
Code) to support this Java tracing capability.
10. What does the trace output look like?
Below is a snippet of a sample trace output from a Panther screen containing
calls to Java Screen and Button Handlers.
sm_trace(TRACE) to file c:\test\javacalc.trc called 2012/06/08 11:19:04
11:19:04 sm_ldb_init
11:19:04 getkey SPF5
11:19:15 screen entry calc.scr
11:19:15 screen JPL info form calc.scr
11:19:15 screen JPL form calc.scr
11:19:15 JPL proc start
11:19:15 JPL line 1 global register, memory, operation, op_just_done, degrees,
currency
11:19:15 JPL proc end
11:19:16 Java hook entry screen entry 'calc.scr'
11:19:16 Java entry sm_n_putfield("op_just_done", "1") |